
To access the reports list:
- Click the Main Menu > Reports > Report List from the options (for visual reference see here)
In this window you’ll see the different categories of reports, Sales, Purchasing and Inventory and each section includes reports which relate to that part of your business.
To pull a report:
- Go to the Report List as above and click on the name of the report you’d like to pull. This will open the menu for that report (as pictured here).
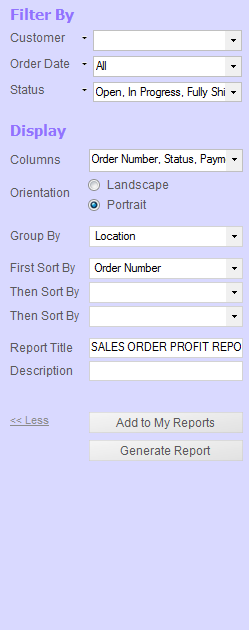
- As with the Listing Views we talked about earlier you can use the filters here to control what appears in the final report. The filters here can be swapped out and added or removed as necessary.
- Click the >>More link to the left of the generate report button (not pictured) to expand the menu so you can see the Display section (as pictured here).
- Choose which columns you want to include in your report by checking them off in the Columns dropdown.
- Next, choose how you’d like to group your order
- Choose the info you’d like to use to sort your data in the Sort By fields.
- When you’re ready, click the Generate Report button to pull your data.
From here you can print or export your report using the toolbar along the top of your screen. This allows you to customize the report that you’re pulling.
Still unsure, or looking for more info?
Have a look at our Reports tutorial video for a closer look.
